
Value Axis vs. Category Axis
SciChart 2D WPF Features several axis types. All inherit from AxisBase.
What is a Value Axis vs. a Category Axis?
SciChart WPF Features both Value Axis and Category Axis types. An explanation of these is given below:
Given the data
|
Age (XAxis) |
Cats |
Dogs |
Fish |
|
1 |
7 |
7 |
8 |
|
9 |
6 |
5 |
7 |
|
10 |
5 |
4 |
3 |
|
20 |
4 |
3 |
2 |
A Value X-Axis and Category X-Axis would display the data differently:
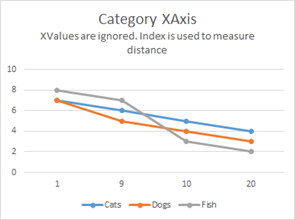
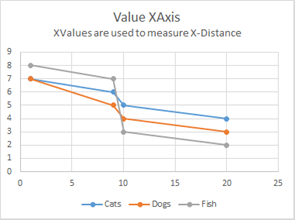
The fundamental difference is a Value-Axis uses the X-Value to compute distance on the XAxis, whereas a Category-Axis uses the X-Index. Value-Axis are primarily used in scientific software where Category –Axis are typically used in financial software (e.g. stock charts).
SciChart features both Value-Axis and Category-Axis types.
| Axis Type | Value or Category Axis |
| NumericAxis | Value Axis |
| LogarithmicNumericAxis | Value Axis |
| DateTimeAxis | Value Axis |
| TimeSpanAxis | Value Axis |
| DiscontinuousDateTimeAxis | Value Axis |
| IndexDateTimeAxis | Category Axis for Stock Charts |
| IndexNumericAxis | Category Axis |
| CategoryDateTimeAxis | Category Axis |
| CategoryNumericAxis | Category Axis |
See Also